Electrical Components Industry Review (WCC, HUBB and NVT)
A Review of my 2025 Capital Group Summer Project

Part I: Executive Summary
Last summer, I completed an investment research project during my internship at Capital Group, focused on the electrical components and grid infrastructure supply chain. The assignment was straightforward: develop investment recommendations for three companies in the sector and support them with detailed fundamental analysis. I was given Wesco, Hubbell, and nVent to research, each of which sits in a different part of the electrical ecosystem and offered a distinct way to express a view on grid investment, electrification, and data centre demand.
I rated Wesco a strong buy, Hubbell a long-term buy, and nVent a relative sell. The core idea running through all three was that US electricity demand had begun to inflect upward after decades of stagnation, and that the resulting utility and infrastructure capex cycle would create a durable growth backdrop for the supply chain. Yet within that context, I still needed to decide which companies were best positioned to translate that demand into durable returns on capital and shareholder value.
Since those recommendations were made in August 2025, six months ago, the stocks have performed as follows:
[Strong buy] Wesco: +49% price return (+0.5% dividends)
[Long-term buy] Hubbell: +23% (+0.6% dividends)
[Relative sell] nVent: +28% (+0.5% dividends)
Wesco outperformed the other two by a wide margin. My thesis rested on its growing exposure to utilities and data centres, improving capital discipline following the Anixter integration, and the potential for significant free cash flow improvement as working capital normalised. End-market demand has remained robust, and operational execution has been solid, supporting the share price. The free cash flow inflexion has not materialised yet, largely because elevated inventory has been required to support strong project activity rather than reflecting excess. Even so, the direction of travel has validated my view that Wesco was evolving from a cyclical distributor into a scaled supply chain partner embedded in a structural grid and data centre investment.
Hubbell performed broadly as expected. The thesis was centred on its positioning in high-reliability utility components, where pricing power and returns on capital tend to hold through cycles, combined with disciplined capital allocation and credible operational execution. Results since August have largely followed that framing. Utility and data centre demand remained supportive, margins held up well, and the DMC Power acquisition reinforced Hubbell’s focus on transmission and substation infrastructure. The stock has delivered solid returns rather than dramatic outperformance, which aligns with the original view of Hubbell as a steady compounder rather than a deeply mispriced opportunity.
nVent also generated a positive return, reflecting the strength of the broader electrification and data centre narrative. My view was that the valuation already assumed smooth execution and sustained improvement in returns on capital despite ongoing portfolio repositioning and exposure to more competitive end markets. Operationally, the company has continued to grow and maintain credible exposure to attractive markets, but returns on tangible capital and margin progression have not yet shown a clear step change. In that sense, the distribution of outcomes still appears wider than the valuation implies. While price momentum remained strong for much of the period, it has recently lagged the other two names; I maintain my caution on the stock and expect it to underperform going forward.
I am writing this review now for two reasons. First, I have often been asked about my views on the electrical and grid infrastructure sector following my internship, particularly given the growing focus on AI data centres and electrification. Second, enough time has passed that I can now share the broad conclusions of the work without creating issues around timing or disclosure. Reviewing the project after the fact is also useful for my own development. Investment work is only as valuable as the feedback loop that follows it, and revisiting the original theses against what actually occurred helps sharpen judgment for future decisions.
What follows is both a summary of that original research and a reflection on how it played out.
Part II: Industry Landscape
2.1 The Grid Ecosystem for a Generalist Investor
It is useful to map the electrical industry against the backdrop of the grid's physical architecture. Electricity follows a staged journey:
Generation: assets that create electricity, from gas turbines and nuclear plants to wind and solar.
Transmission: the high-voltage backbone that carries power across regions. Regulated at the federal level by FERC, where returns are set to incentivise build-out.
Distribution: the lower-voltage networks feeding neighbourhoods, factories and data centres. Governed by state regulators with tighter oversight of allowed returns.
Consumption: the assets that use electricity. Data centres, industrial facilities, commercial buildings and electrified transport infrastructure. This layer drives demand and the buildout of the other layers.
Transmission and distribution are typically grouped together as “utilities”, while consumption is often referred to as “electrical” end markets. The distinction is useful because the economics, cycles and valuation frameworks for each behave differently.
Wesco, Hubbell, and nVent are part of the supply chain that enables this entire system. They manufacture or distribute the physical components that allow the grid to function and expand. Their catalogues span transformers, connectors, insulators, surge arresters, switchgear, cable management systems, enclosures and thousands of ancillary parts. Revenues ultimately track the volume of hardware required to maintain and build out the network.
2.2 Value Chain Segmentation
This review focuses on the manufacturing and distribution segments of the electrical supply chain. Raw materials sit upstream. Utilities, EPCs, data centre developers, industrial operators and commercial builders sit downstream. Between them sits a dense ecosystem of manufacturers and distributors that design, produce and deliver the equipment required to keep electricity flowing.
The economics of this middle layer vary significantly depending on where a company sits within it. Some segments benefit from high switching costs and stable demand. Others are more competitive and more cyclical. Understanding those differences is useful when deciding where to allocate capital within the sector.
Utility manufacturing builds mission-critical hardware for poles, substations and transmission infrastructure. Products include high-voltage connectors, arresters and insulators. Buyers are loss-averse. A failed component risks outages, fines and regulatory scrutiny. Qualification cycles stretch over years, and the installed base matters. Pricing power is strong, barriers to entry are high, and returns on invested capital are typically resilient. This is generally the most structurally attractive part of the supply chain. Hubbell has the heaviest exposure here.
Electrical products manufacturing serves buildings, commercial construction, and light-industrial projects. Products include enclosures, cable management, fastening systems and thermal solutions. Reliability still matters, but customers are more fickle, tolerance for substitution is higher, and pricing is more competitive. Sales swing with construction cycles, and returns are more variable. Large parts of nVent’s portfolio fall into this category.
Distribution connects manufacturers to end markets. Large projects require sequencing tens of thousands of SKUs from multiple suppliers to job sites with tight tolerances. The distributor absorbs lead-time volatility, labour constraints and supply chain friction. Margins sit in the mid-single digits, and returns are driven by capital velocity and working capital discipline rather than pricing power. Scale, service depth and end-market mix separate strong distributors from those that compete away their spread. Wesco is one of the largest distributors in the industry.
From a capital allocation perspective, utility-grade manufacturing appears structurally most attractive, electrical products manufacturing sits in the middle, and distribution tends to offer the weakest underlying economics. That is not to say distributors are inevitably bad stocks or businesses, but positioning and execution will matter more here.
Part III: Sector close-up: Utilities
Beyond the data centre buildout (which was already a highly sought-after end market at the time of my research), utilities expansion is one of the most significant growth drivers in my coverage. I spent some extra time exploring the dynamics in this end market because I felt the growth and its duration were being underestimated by the market.
3.1 The Load Growth Inflexion
US electricity demand has inflected upwards. For the last few decades, peak demand was expected to grow annually by less than 1 per cent over any forward-looking ten-year period. Suddenly, that number has jumped to around 2 per cent (with higher estimates near 2.5 per cent). A 1 per cent difference may feel small, but it compounds and leads to large shifts in capex spending, which I’ll explore later.
Most people assume most of this demand increase comes from AI data centres. While they are a fast-growing segment, this large percentage growth is off a small base. Data centres consume roughly 4 to 5 per cent of US electricity today and are tracking toward 8 to 10 per cent by the late 2020s (with AI data centres growing over 20%). Industrial reshoring, transport electrification, and building electrification account for a large share of steady baseline growth. We will need our grid to handle more peak demand, regardless of whether the AI data centre buildout keeps pace. The takeaway is that we are transitioning from flat demand to structural, diversified demand growth.
3.2 The Capex Forecast Disconnect
Over the last decade, though US electricity demand was essentially flat, utility capex still compounded at a little over 7 per cent a year. That spending rate was needed just to keep an ageing network operational. This baseline capex growth is unlikely to change as the existing grid continues to age.
Last summer, as I was working on this project, the highest official projections for grid investment were $1 trillion by the end of the decade. This number was cited as aggressive and record-setting. This was true in absolute terms, but it effectively anticipated no inflexion in capex growth. $1 trillion over the 2025–2030 period roughly corresponds to the same mid-single-digit growth utilities have already delivered in a flat-demand era. Real load growth is returning, yet guidance remains anchored at 6 to 8 per cent as the demand inflexion had not occurred. Investor-owned utility companies’ capex guidance generally still reflects the habits of the stagnant era because it feels defensible in rate cases and aligns with backwards-looking averages.
To establish what capex growth should probably look like, I looked for regions in the US that had experienced healthy load growth. In parts of Texas and the Eastern interconnect, areas that actually saw load growth of around 2 per cent in the past decade, capex growth was around 13%. On that basis, I believe a trajectory of 10+ per cent for US utility capex looks more realistic over time.
Pressure points are accumulating. Transmission corridors are running with less spare capacity, substation projects increasingly involve reinforcement rather than incremental upgrades, and interconnection queues are lengthening. The grid can tolerate this for a period, but these constraints compound. While it is challenging to know precisely when capex guidance might inflect upwards, it seemed to be a matter of time as demand builds and capex does not accelerate to meet it. My view, treated with some scepticism last summer, seems to be becoming more accepted in the market, with more recent estimates of capex spending rising from $1tn to $1.4tn (Deloitte, Oct 2025)
This all matters because higher demand should force higher capex. Higher capex flows directly into orders for equipment, components and distribution services. If capex growth ultimately shifts from the 6 to 8 per cent range toward something closer to 10 per cent or higher, revenue expectations for the supply chain should reset accordingly. Most forecasts for the companies I covered still embed the lower capex regime. If the spending trajectory re-rates, earnings estimates are likely to follow. This dynamic makes companies with exposure to the utilities supply chain attractive.
Part IV: Framework of how to make Money in Electrical Component Companies
I think there are four principles to keep in mind when investing in the sector:
Electrical component companies tend to be impressive industrial compounders. Over the last twenty years, both manufacturers and distributors generated market-beating IRRs by growing steadily through cycles and deploying capital efficiently.
These are cyclical stocks. They periodically trade at distressed multiples when construction slows, inventories build or macro fears dominate. Buying during those dislocations has historically driven outsized returns. At the time of my work, the group was not distressed, but valuations were reasonable relative to the structural backdrop.
Returns in this sector correlate strongly with regional load growth. Historical examples from China and India show that electrical component manufacturers delivered strong earnings and shareholder returns during periods of rapid load growth despite falling gross margins and rising competition. In China, load growth of roughly 7 to 8 per cent supported near 20 per cent earnings growth even as margins declined. Indian manufacturers saw a similar pattern. Volume growth outweighed pricing pressure. The implication is straightforward: when the grid is expanding, revenue growth and accompanying operating leverage alone can sustain strong returns. As the US shifts from flat demand to sustained load growth, the sector's prospects improve materially.
A regression analysis of electrical distributors suggests that roughly two-thirds of long-term returns can be explained by three variables: high ROIC, short cash conversion cycles and low capital intensity. Distributors that generate strong returns on capital while keeping capex and working capital requirements low have historically delivered the highest IRRs. Electrical equipment manufacturers appear less formulaic. No single financial metric reliably predicted long-term performance for my manufacturing basket. I believe outcomes here depend more on qualitative factors such as management decision-making, sub-market structure, product stickiness, and exposure to commoditisation, all of which change frequently.
Simply put, own compounding businesses positioned inside sustained load growth and hold them through the cycle. If you can buy them cheaply, all the better.
Three Company Recommendations
Wesco International (WCC)
Initial view: strong buy recommendation at ~$206 (August 2025)
Return: 49% price return (+0.5% in dividends)
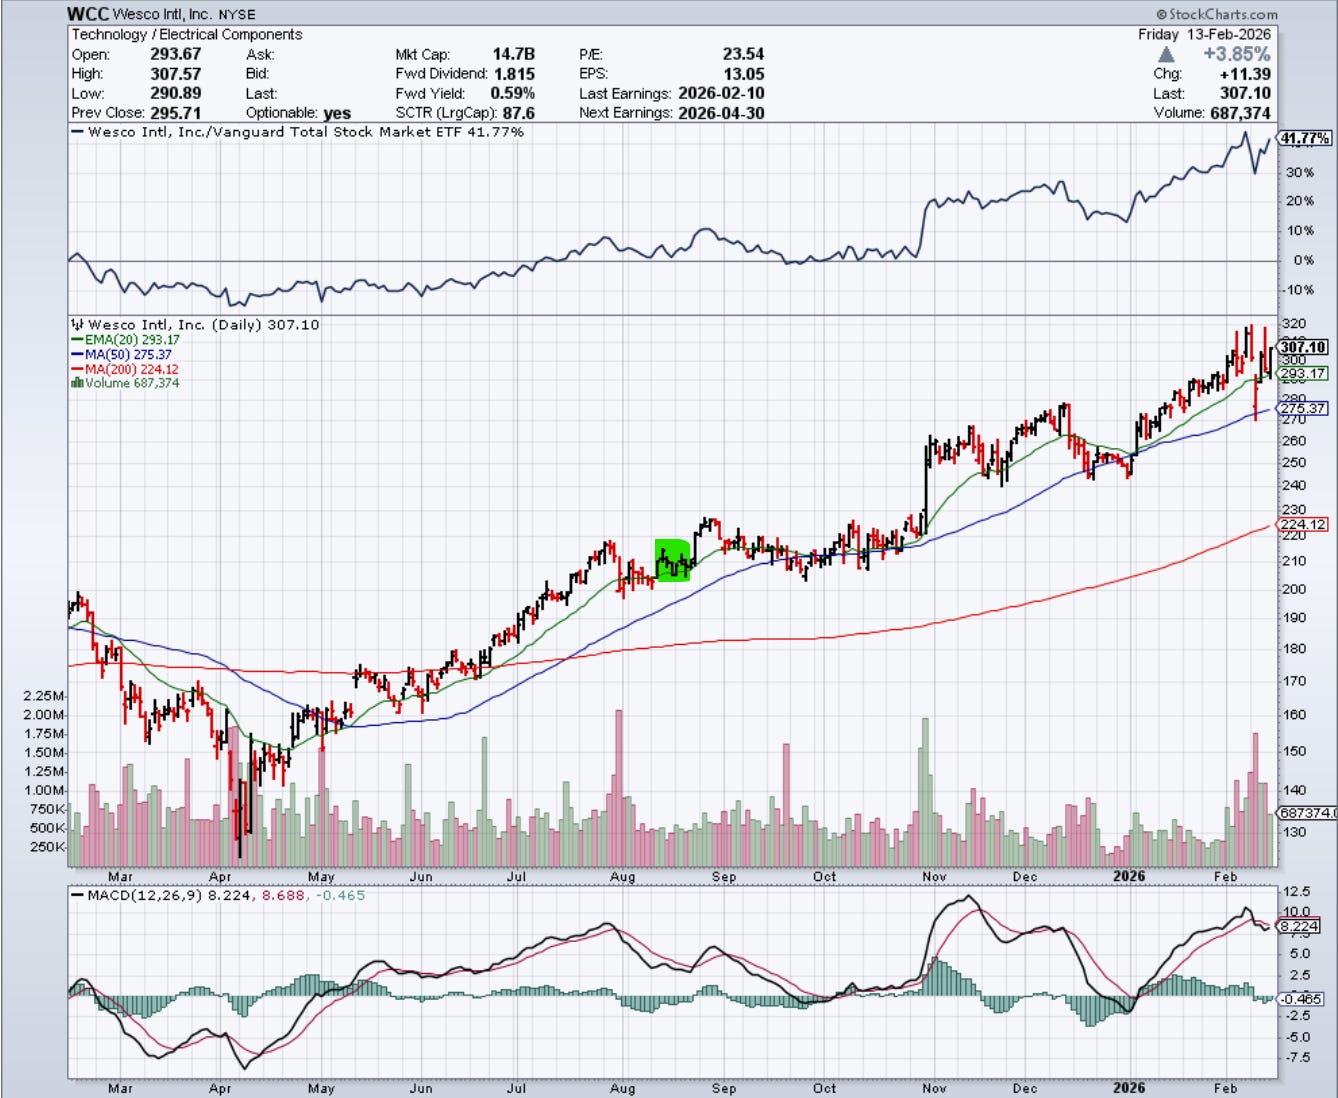
Wesco was the most controversial name in the group. Distribution is structurally less attractive than manufacturing, margins are thin, and working capital requirements are heavy. Yet within the sector, Wesco appeared positioned to compound at a higher rate than most distributors, while still being heavily discounted as a cyclical intermediary tied to construction. My thesis rested on three ideas.
First, Wesco had one of the strongest end-market mixes among global electrical distributors. A growing portion of revenue (likely 50% within a couple of years) was tied to utilities and data centres, two areas where spending is driven by capacity requirements rather than cyclical construction. Utilities were entering a multi-year period of grid reinforcement and expansion, while hyperscale data centre construction was accelerating as compute demand increased. These end markets offered greater visibility and duration than traditional commercial construction and suggested structurally higher organic growth than the market was assuming.
Second, scale and operating discipline were beginning to show through in the financials. Following the Anixter acquisition and several years of integration work, Wesco had built a broader service offering and greater procurement leverage. Management focus had shifted toward return on invested capital and free cash flow rather than revenue growth alone. In distribution, modest margin stability combined with improving capital efficiency can drive meaningful earnings growth. Wesco appeared to be moving toward the profile of a compounding distributor: stable margins, improving returns on capital and increasing operating leverage to volume growth.
Third, the largest perceived disconnect sat in working capital and free cash flow expectations. Inventory and receivables had expanded materially through the pandemic and acquisition integration period. The market treated this as structural. My view was that a meaningful portion reflected temporary supply chain conditions and integration inefficiencies. As systems consolidated and supply chains normalised, even a partial improvement in working capital intensity could release substantial cash. At the time, consensus models did not fully reflect this potential, creating a notable potential gap between reported earnings and forward free cash flow.
What happened
Since the recommendation, demand from utilities and data centres has remained strong. Wesco continues to benefit from project activity tied to grid expansion and hyperscale buildouts. These segments have provided a durable growth base and reinforced the view that the company’s exposure is structurally stronger than that of a typical distributor.
Operating performance has been broadly consistent with the thesis. Margins have remained stable, and management has continued to emphasise capital discipline and returns on invested capital. However, working capital has not unwound as quickly as initially expected. Strong project demand and long equipment lead times have required Wesco to carry higher inventory and receivables to support customer activity. In effect, inventory has been required to support growth rather than being released as excess.
As a result, and disappointingly, the free cash flow inflexion embedded in the original thesis has been delayed. Inventory and receivables remain elevated, driven by active projects and the backlog rather than weak demand. If growth moderates and supply chains stabilise, working capital intensity should improve, and cash conversion should strengthen.
Wesco today appears less like a cyclical distributor and more like a scaled logistics and supply chain partner to utilities and data centre developers. The core question is timing rather than direction. If utility and data centre spending continue to expand and working capital normalises, Wesco should continue to outperform. My only complaint would be the delay in bringing down working capital levels.
Hubbell (HUBB)
Initial view: buy recommendation at ~$427 (August 2025)
Return: 23% (+0.6% in dividends)
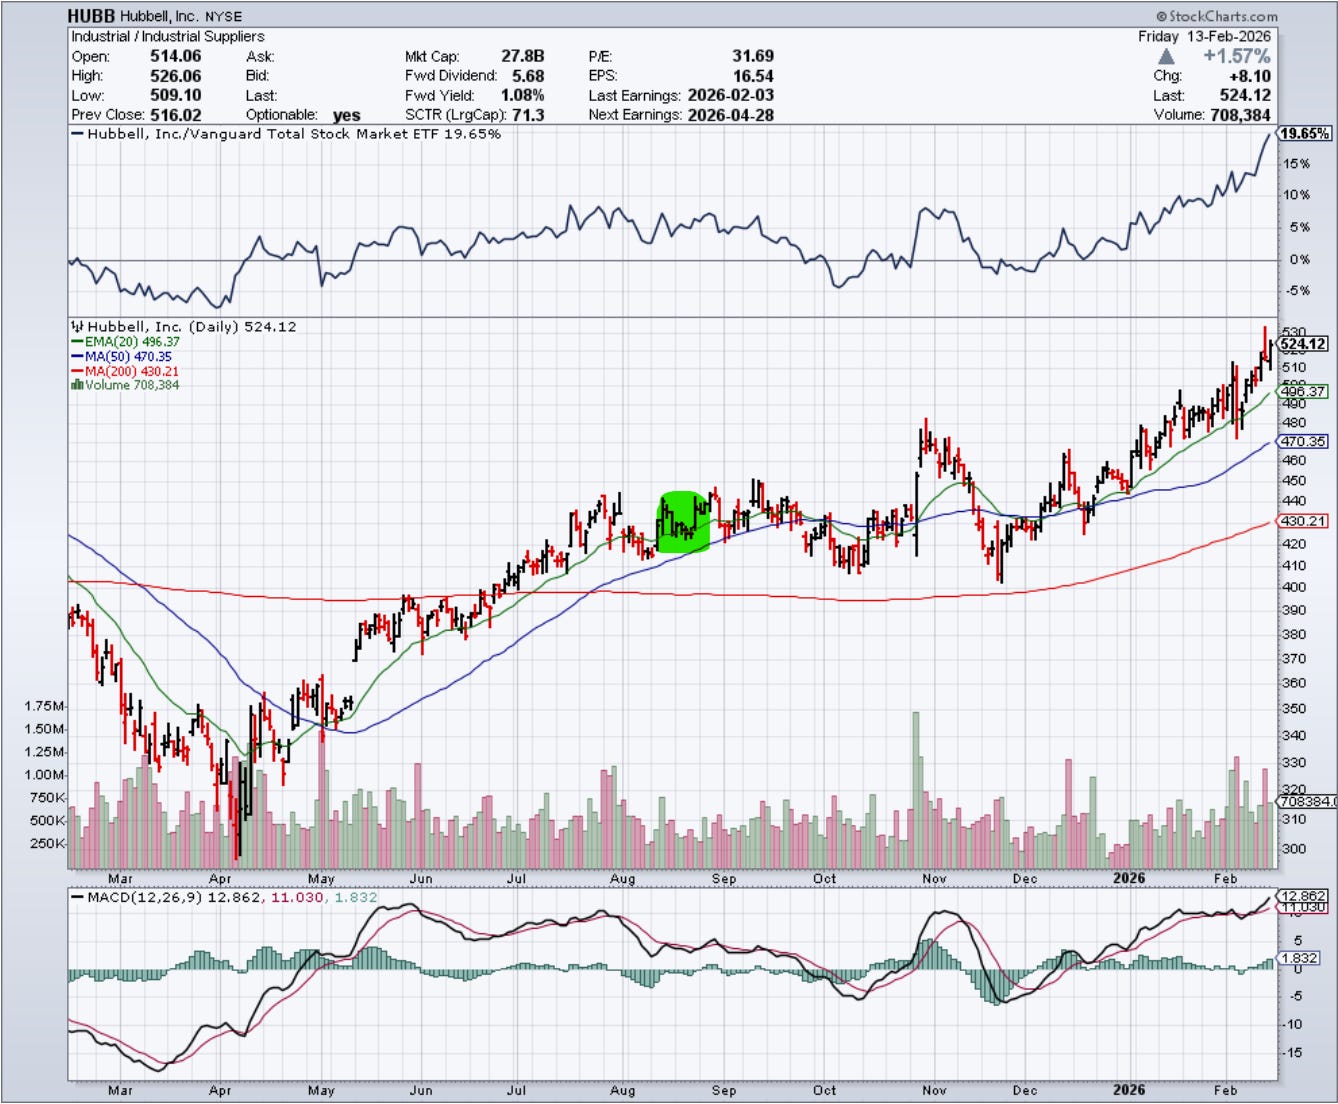
I recommended Hubbell as a long-term buy because I saw it as a high-quality business with strong tailwinds. The stock was not at the steep discount I perceived Wesco to be at, but the business would likely deliver market-beating returns over the next five years or decade. My thesis again rested on three parts:
First, Hubbell’s utility exposure is concentrated in the parts of the grid where reliability matters and switching costs are high. In substation and transmission components, the cost of failure is high, and qualification cycles are long. That tends to produce stable pricing, resilient margins, and high returns on invested capital through macro swings. The bet was that as US load growth pulled utility spend higher, Hubbell would capture both volume and pricing without the usual industrial margin give-back.
Second, Hubbell had credible operational levers to translate demand into earnings. The company had been simplifying the business, pushing productivity initiatives, and leaning into mix improvement. While Hubbell stands to benefit the most if grid capex spikes (as I think it might), the stock really only needed steady utility T&D demand plus consistent execution to do well. If prices and productivity continue to outpace cost inflation, margins could remain elevated even as growth normalises.
Third, I viewed Hubbell as a rollup, whereas analysts were modelling only organic growth. I expected M&A to remain a meaningful source of incremental growth, especially in utility connectors and tooling, where the economics are attractive.
What happened
The results since August have broadly validated the original thesis. Hubbell has continued to behave like a high-quality utility supplier with stable margins, strong demand and disciplined capital allocation.
The most direct confirmation came through M&A. Hubbell announced the $825 million acquisition of DMC Power in mid-August, explicitly linking the deal to rising transmission and substation investment driven by load growth, data centre expansion and ageing infrastructure. The transaction closed on October 1 and is expected to be accretive to earnings in 2026. The deal reinforced the view that Hubbell is not just a passive beneficiary of grid investment but an active consolidator of high-quality utility components.
Operating performance through the second half of the year was consistent with expectations. Revenue and earnings grew steadily, supported by continued strength in utility transmission and distribution markets and ongoing data centre investment. Pricing and productivity more than offset cost inflation, allowing margins to hold up well. Within the utility segment, core grid infrastructure remained strong while grid automation and metering were softer, reinforcing the idea that not all utility spending moves in lockstep. Overall, results reflected a business benefiting from sustained infrastructure demand and executing in line with the steady compounder profile outlined in the original thesis.
The remaining question is pace rather than direction. Some utility sub-segments, particularly metering and grid automation, have been softer than core transmission and distribution hardware. This creates periodic noise but seems unlikely to alter the broader trajectory.
Sustained utility and data centre investment, combined with consistent execution on pricing, productivity and capital allocation, continue to support the original thesis. Hubbell no longer looks obviously cheap, but it remains a durable compounder positioned on the right side of the grid investment cycle.
nVent (NVT)
Initial view: sell recommendation at ~$88 (end of August 2025)
Return: 28% (+0.5% in dividends)
I rated nVent a sell because I believed the risk profile was higher than the stock price implied. It is a credible industrial with real exposure to data centres, utilities and electrification. However, I believed the market was underwriting a near-perfect outcome from those growth vectors while overlooking weaker underlying economics, aggressive portfolio repositioning and incentives that did not appear tightly aligned with long-term value creation. I positioned it as a sell relative to the other companies, feeling cautious around the company rather than pessimistic. My thesis had three core elements.
First, returns on tangible capital and the trajectory of margins did not support the value-creation narrative. Since the Pentair spin, nVent has repositioned its portfolio through a steady stream of acquisitions and divestitures. However, its returns on tangible capital (ROTC) were in the low teens, below key peers, and remained steady, as almost every competitor was improving its ROTC under favourable market conditions. Management framed acquisitions as accretive and strategically necessary, but this was not clearly visible in reported returns or margin progression. Gross and operating margins had improved through 2023, but began to flatten and then soften as inflation, tariff costs and mix weighed on profitability. Acquired businesses often carried lower margins, and integration costs and higher SG&A limited operating leverage. I viewed the path to sustained margin expansion as uncertain, even though the valuation already implied steady improvement.
Second, the pace and scale of portfolio change introduced execution risk and obscured underlying performance. Since 2018, nVent has turned over a large portion of its portfolio in an effort to increase exposure to utilities and data centres. While strategically logical, this level of repositioning created integration risk and made it harder to assess the business's organic earnings power. Transaction value as a percentage of market cap was far higher than that of peers, and a growing share of assets sat in intangibles, raising the risk that reported earnings and returns would lag the underlying capital deployed. Management appeared committed to continuing the acquisition programme, suggesting that elevated deal activity and integration risk would persist.
Third, despite the excitement in the stock due to the business’s growing exposure to data centres, a large share of revenue remained tied to more cyclical and competitive electrical products markets (e.g., commercial, residential, industrial and broader energy end markets). These segments tend to be more price-competitive, more cyclical, and more exposed to commoditisation than utility-grade infrastructure. At the same time, the data centre opportunity, while real, was becoming increasingly crowded. Multiple suppliers were expanding capacity and targeting similar product categories, raising the risk that volume growth would not translate cleanly into sustained pricing or margin gains.
Taken together, I believed the company could continue to grow earnings, particularly if data centre demand remained strong, but that the distribution of outcomes was wider than the market implied. The stock appeared to be priced for smooth execution, steady margin expansion, and continued multiple support. In my view, the combination of modest returns on capital, ongoing integration risk and exposure to competitive end markets meant the margin for error was limited.
What happened
The story since August broadly supported that positioning. nVent continued to deliver solid operational performance and maintained exposure to attractive growth markets, particularly data centres and utilities. Revenue growth remained steady, supported by electrification and infrastructure demand, and backlog tied to data centre projects provided continued visibility.
However, the underlying economics evolved largely as expected. Margins flattened and then softened modestly as mix, inflation and integration costs weighed on operating leverage. Productivity and pricing actions helped offset some of these pressures, but not enough to drive sustained margin expansion. Returns on tangible capital remained broadly steady rather than improving meaningfully, even as end markets remained supportive.
While many of these concerns proved directionally correct, price momentum remained strong, and the stock still delivered a solid return, supported by a rising sector and continued enthusiasm around electrification and data centres. Momentum now appears weaker relative to Wesco and Hubbell. Looking ahead, I remain more cautious on nVent than on the other two names. The business is credible and exposed to favourable themes, but with stagnant margins and returns on capital, continued integration risk and a more susceptible-to-cycles portfolio mix, the risk-reward still appears less compelling.
Author’s Disclosure: I do not currently hold beneficial long positions in the abovementioned company through stock ownership, options, or other derivatives. I may buy or sell the stock while you are reading this. I wrote this post myself, and it expresses my own opinions. I have no business relationship with any company whose stock is mentioned in this article. No recommendation or advice is being given as to whether any investment is suitable for a particular investor. I am not a licensed securities dealer, broker, US investment adviser or investment bank.